Site maintained by Peter Carter, Climate Emergency Institute

Dire Climate System Emergency
CO2 emissions
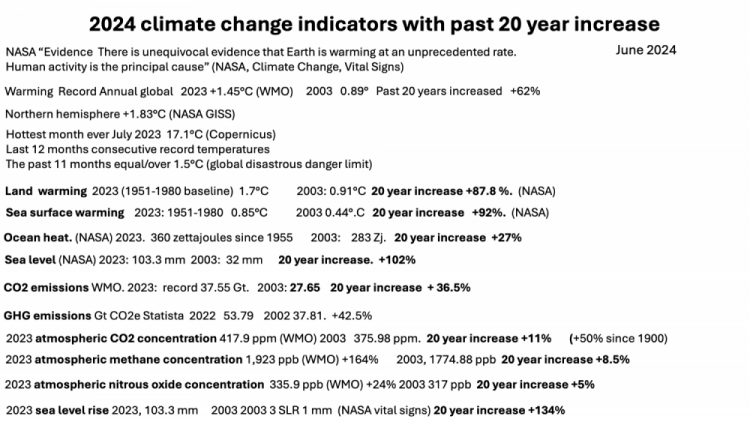
2023 Record high IEA 37.4 Billion tonnes
Rapid increase sustained from 1960
Greenhouse gas emissions
2022 Record high
Rhodium Energy 50.6 billon tonnes
Atmospheric CO2
May 2024 Record high NOAA 423.53 ppm
Highest in 14 million years Record 2 year increase Accelerating
Atmospheric greenhouse concentrations
All (CO2, CH4, N2O) Record high NOAA May 2024 Accelerating increases
May 2024 CO2 423.53 ppm methane 1,930 ppm. nitrous oxide 337.5
Atmospheric CO2 eq & radiative forcing NOAA AGGGI
2023 CO2 eq 540 ppm
Radiative forcing GHGs 3.48 W/m-2 Effective RF 2.79 Wm-2
Forster et al June 2024 climate change indicator update 2024
Carbon sinks efficiency decline(Global Carbon Project)
In 2023 Land carbon sink efficiency decline by 2020 Ocean sink by 7%
2023 Global temperature increase
Record global warming 2023 WMO 1.45°C
Copernicus May 2024 record 1.52°C 12 consecutive months of record warming
11 months at/above 1.5°C
Record high by decade Statista 2011-2022 Each decade higher
Northern hemisphere temperature increase much faster than global
NASA GISS NH warming 1.84°C 2023
Global warming Index 1.3°C May 2024 (warming of emissions only)
2022 Ocean heat content
Cheng June 2024Record high 2023: 247 ZJAccelerating increase
Rapidly increasing trend from 1960 Record Increase every year
(One zettajoule of energy is roughly equivalent to ten times the electricity generated worldwide in a year).
Sea surface temperature (SST)
Cheng June 2024 Anomaly Record high 2023 0.54°C
NASA GISS SST increase 1.14°C (re. 1880-1920)
Copernicus SST Record high Since 1980 +0.55°C
Ocean acidification
Statista (line graph) and NOAA 2023 PMEL pH 8.05
Accelerating increase, Rapid increase from 1960
Ocean deoxygenation
Takamitsu Ito et al 12 Feb. 2024
1.5% oxygen decline past 50 years
Polar regions (cryosphere)
NOAA, NSIDc, Copernicus
Composite Arctic sea-ice, Antarctic sea ice, Greenland ice sheet, Antarctic ice sheet
Arctic Temperature increase
NOAA Arctic Report Card
Summer 2023 Arctic's hottest on record. Some areas, 7.2°F above t 1991-2020
NOAA, NSIDc, Copernicus
Composite Arctic sea-ice, Antarctic sea ice, Greenland ice sheet, Antarctic ice sheet
Arctic Temperature increase
NOAA Arctic Report Card
Summer 2023 Arctic's hottest on record. Some areas, 7.2°F above t 1991-2020
Arctic sea ice Sept Minimum
NASA Vital signs 4.37 million sq. km. Levelled off since 2012 record low
Antarctic sea minimum
NOAA 1.79 million sq. km.
Second lowest Third consecutive year below 2 million sq. km. (772,000 sq, miles)
NASA Ice sheets
NASA Greenland ice sheet - 5444 Gt Linear decline since 2002
NASA Antarctic ice sheet -2734 GT Levelled of since 2021
Arctic record changes Composite of sources 2021-2022
Rapid, dangerous polar changes
Double click here to edit this text.
STATUS
June 2024
